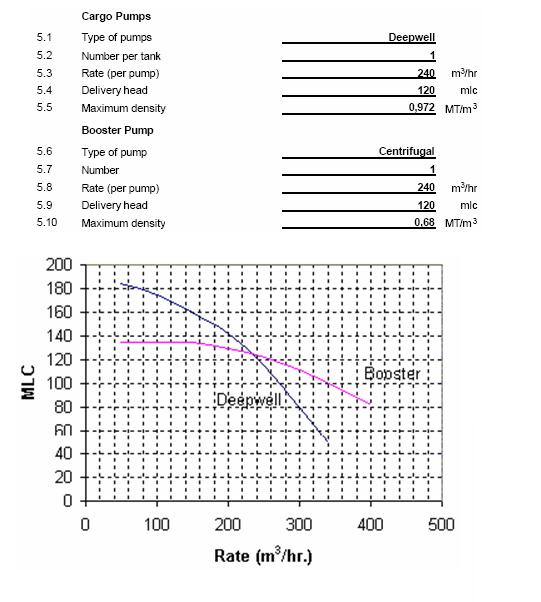
All modern gas ships are equipped with performance curves for the cargo pumps, and it is important that the cargo officers can use such curves correctly. The Pump Curve below shows a diagram where performance curves for cargo pumps and the characteristics for the piping system are plotted. The characteristics for the piping are made up of the static and dynamic back pressure. The static back pressure is mainly the difference in liquid level in the ship's tanks and the shore tanks, and the difference between the tank pressure on board and ashore. The dynamic back pressure is the friction created in valves, bends and piping, etc.
From the Pump Curve below we read that the pump under the given conditions delivers 180m3/hour and the delivery head (H) is 150 mLC.
If we wish to find what l50mLC corresponds to as pump discharge pressure (Pump manometer pressure) at the tank dome,we have to carry out the following calculation (we consider the pump medium to be propylene at +100C in this example). P = Density at temp · g · H
Propylene density @ +10 Celsius = 532.0 kg/m3
g = 9.81 m/s2
Pump discharge pressure = 532.0 x 9.81 x 150 = 782838 Pa = 7.83 bar
We have now calculated the pump discharge pressure (P) by multiplying the propylene density at +100 Celsius with the magnitude of the gravity force (g) and the delivery head (H).
We can change the dynamic back pressure by e.g. throttling the pump discharge valve. Let us consider that we shall reduce the discharge rate from 180m3/hour to 120m3/hour by throttling the manifold valve. What will the manometer reading on the tank dome show?
Firstly we have to check the Pump Curve below for the piping characteristics with a discharge quantity of 120m3/hour as basis, and we find that the new delivery head will now be 170 mLC. Hence we can again calculate the manometer pressure as follows: P = Density at temp · g · H
New Pump discharge pressure = 532.0 x 9.81 x 170 = 887216 Pa = 8.87bar
In other words, we can throttle the manifold valve until the manometer has risen from 7.83bar to 8.87bar. The new rate of delivery should then be 120m3/hour.
If we take a reading of the manometer pressure, we can on the other hand find the delivery head and delivery quantity. Let us look at the following example. We have the basis as in the previous situation, but the manometer pressure reading at the dome is reading 7.40bar (740000Pa). What will the delivery head and the delivery rate be? H = P/ (Density @ temp x g)
H = 740000/(532.0 x 9.81) = 141.82 mLC
With a delivery head of 141.8 mLC we will find from the performance curve that the delivery rate is now 200m3/hour. As can be seen, it is not necessary to draw a new piping characteristic curve for such calculations.
(mLC means – meter Liquid Column)
C – Vessels - Discharge – Pump Curves
If a ship is to deliver a larger quantity of cargo per time interval than the capacity of one pump, we normally have to use two or more cargo pumps in parallel. From a Pump Curve showing two or more pumps in parallel (Combined Curve) we can calculate the delivery quantity (and discharge head) when two or more pumps are run in parallel.
As the piping characteristics remain the same, the new delivery rate will be high. The performance curve for two pumps run in parallel is the added x-axis values (delivery capacity) for each pump at different delivery heads. If two pumps are run in parallel, the best (cheapest) way is to have one common throttling valve on the discharge line. Any possible imbalance between the two pumps can thereby be counteracted.
If the ship shall deliver cargo with higher delivery head than possible with one pump, we normally have to run two or more pumps in series. On board a gas ship this is usually done by using one booster pump in series with one or more deep well pumps.
To find the combined capacity curve for one deep well pump that run in series with one booster pump, we have to add together both the pumps y-axis values (delivery head) for the different capacities.
Liquids with a viscosity of 5 cst or less have little influence on the pump performance-curve, but with values over this the pump effectiveness will decrease together with the capacity and the delivery head. As the cargoes on gas ships have a very low viscosity, we do not need to consider this parameter.
|
Condition for Pump Suction
|
|
The operation condition for the centrifugal pump on the suction side is decisive for the working of the pump. As the liquid gas is accelerated from the centre of the impeller and out towards the rim, the liquid gas will create a temporary reduction in pressure.
If the liquid is already at its boiling point, this reduction in pressure will result in vaporization of the liquid, and thereby form vapour bubbles. It has been discovered through many experiments that a normal centrifugal pump can operate satisfactorily with about 2% vapour in the liquid. On increasing the formation of bubbles above this, the consequence will be that the vapour bubbles collapse as the pressure is increased.
This will create shock and erosion (cavitations) in the pump, and consequently material damage. A variable discharging quantity can also be the result of vapour in the pump.
To safeguard against vapour in the pump, we can make sure that the liquid on the suction side has the necessary over-pressure to avoid vaporization. The suction pressure can be improved by fitting the pump with an inducer. The inducer is a flow governor wheel fitted in front of the (first) impeller.
Cavitations are a well known phenomenon for Gas operators on board LPG vessels. Despite all the enormous effort put into this field, the knowledge is still incomplete. Cavitations in a centrifugal pump can arise when a liquid, either by temperature increase or by pressure reduction attains the liquid vapour pressure. Vapour bubbles or cavities will be formed in the liquid during pumping. If the conditions are altered, the vapour may be condensed and the bubbles collapse. This process will normally disturb the regularity of the liquid flow.
Cavitations may result in:
· Damage to the impeller and housing (normally called erosion or pitting).
· Noise, covering a wide spectrum.
· Vibrations in the liquid flow and pump/motor.
· Loss of efficiency.
All these acts in a destructive way, is unwanted and has either to be eliminated or controlled.
From what has been previously mentioned, it is clear that the liquid static pressure at the pump must not be reduced to the vapour pressure, if we are to avoid cavitations. |